THE FIRST VICTIM of an avalanche this winter was a 33-year-old snowshoer hit by a slide near Lake Wenatchee on January 29. He may not be the last. “We’re going to be very lucky if he’s the only person that’s killed,” says Mark Moore of the Northwest Avalanche Center, which has operated an often financially beleaguered Web site since 1996.
While the NWAC has struggled to keep its life-and-death forecasts online, a few cubicle walls away, fast, powerful computers have been buzzing with data at our regional National Weather Service center, also located at the National Oceanographic and Atmospheric Administration’s Sand Point complex. (The NOAA is parent to the NWS, which manages 121 different regionally tailored Web sites.) Our NWS home page gets around 5 million hits per year, making it one of the most popular weather resources in the Northwest. Yet the taxpayer-funded site has been shut down twice in its six-year history because of tangles with commercial sites.
Government policy prohibits such public sites from competing with private, for-profit Web pages. “It’s not without conflict,” says Brad Colman, science and operations officer for the NWS. He adds that the NWS’ mission is officially limited to “protection of life and property.” As a result, the government no longer does agricultural forecasting or consulting for Hollywood film crews (which need to predict sunny days). That’s fine for the NWAC and its small niche forecasts, but plenty of rivals have been stepping on the NWS’ turf.
Commercial weather sites use NWS data primarily to make forecasts. Anything that private forecasters want to claim has the effect of preventing the NWS from developing its site to full potential. That’s why there’s been past weather industry pressure to limit its site to dull text instead of user-friendly maps and graphics.
Who are these competitors? Chiefly the weather pages of local broadcasters like KOMO, KIRO, and KING, whose My-Cast service offers “personalized weather intelligence” and boasts of forecasts updated four times more often than those of the NWS. (If the NWS opted to issue more frequent forecasts from its constantly streaming data, that would place it in competition—which is prohibited, making this a catch-22 for the organization.)
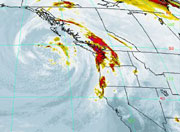
Lending further irony, the very same federally funded bonanza of weather data and computer power that’s enabled the NWS to jazz up its site is just what creates this tension. Begun in 1990, the NWS’ $4 billion modernization program has yielded a veritable golden age in weather in the sodden Northwest. Thanks to government satellites orbiting high overhead, radar sweeping the skies above, and hundreds of ground observation stations constantly beaming live data to NWS supercomputers back in Silver Springs, Md., there’s never been a better time to look at the weather—without even having to look out the window.
JUST LOG ON. Gale warnings, snowstorms, and small craft advisories are color-coded on the NWS site’s map. Click your more precise region to get current info and forecasts, plus recent weather data. Planning a trip to the mountains? Click there. Sailing to the San Juans? Click on the marine zones. Links take you to other local weather pages, like the University of Washington’s very useful Department of Atmospheric Sciences site, online since ’95 and receiving up to 225,000 hits per day. It’s got even more links, including the Pacific Northwest Buoy and Lighthouse page, which allows you to receive current info from, say, Smith Island, Tatoosh Island, or—this writer’s favorite—humble Buoy Number 46029, Col River Bar (“potential explosion hazard exists for this buoy”).
Sailors and sea kayakers will also appreciate the Ferry Weather site, while motorists will dig the I-90 and Highway 2 pass report pages. For video confirmation of weather reports, the Department of Transportation’s traffic cam site is also endlessly fascinating and boasts a clear, well-thought-out design—which points to the challenge of communicating complex weather information visually.
“There’s probably been no time in history where there’s been a bigger gap between what we know and how we disseminate it,” says the NWS’ Colman. Ahead lies the challenge of translating “contours of probability” into graphics. “How do you put this in words?” he muses of one colorful image on his computer screen.
Back at the NWAC, Moore says they’ve tried to remain mindful that some users still have 28.8bps modems. “We’ve tried to keep the graphics and animation to a minimum,” he explains. Despite limited resources, the site will evolve in the fancier NWS direction since so many visitors now have high-speed Internet connections and fast home computers.
“THE HANDWRITING is on the wall,” says UW Department of Atmospheric Sciences professor Cliff Mass. “The Web is the best way to get weather data because there’s too much information. It’s very graphical, and there’s tremendous volume of it. You just can’t do that on TV or radio. It’s clear that the Web will be the way that most people get their weather data in the future.”
Since January, the NWS’ extremely valuable real-time radar data has been accessible directly through its site. (Prior agreements with private vendors, now expired, had limited its dissemination to commercial sites.) As a result, Mass says the NWS should be free to improve the site without fear of retribution. “I don’t think anything’s off limits,” he says.
Back at Sand Point, Colman concurs, recalling how the site was briefly suspended when commercial rivals were first going online. “The whole Web page issue, that was probably five years ago when we were first hitting the street,” he says. “We got slapped” for that, he remembers, and again for “the commercial industry endorsement thing” about two years ago. Then the issue was of NWS links to private sites and the implied favoritism they might confer—like steering traffic to one business instead of another.
“Now we’re able to give you the data on our page directly, and we’re able to do it in the way we want to do it,” Colman explains. So the NWS’ hands are essentially free again? “They are until they get slapped again, yup. We’ve been encouraged to explore as much as we want as far as going into graphical forecasts and animations.”
For us, the owners and end-users of public weather data, such enhancement promises even more sweeping, powerful views of the elements. On his own computer workstation, for example, Colman’s fingers rapidly peck at the keyboard until—after a brief pause—a lovely overlay map of the state pops up. Temperature, wind speed and direction, and geographic features are rendered in pink, green, and black-and-white, showing clear weather and north winds over Lake Washington. Behind him through picture glass windows, the blue skies and gentle waves confirm just what his Web site says. “It’s a great time to be in meteorology,” he declares with a smile. He’s right; it’s beautiful outside.
URLs for local weather Web sites
NWAC: www.nwac.noaa.gov
UW Department of Atmospheric Sciences: www.atmos.washington.edu/data
I-90: www.atmos.washington.edu/maciver/roadview/i90
Highway 2: www.atmos.washington.edu/maciver/roadview/sr2
WSDOT: www.wsdot.wa.gov/pugetsoundtraffic/cameras
Ferry Weather: www.atmos.washington.edu/maciver/Ferry/Ferryjs/ mainframe1.htm
Pacific Northwest Buoy and Lighthouse Data: www.ndbc.noaa.gov/Maps/Northwest.shtml